Foray into Wargaming: A Duel Calculator
In this post, we will explore the application of simple mathematics to simulate outcomes of a tabletop wargame. The game we will be discussing is called Middle Earth Strategy Battle Game (MESBG), set in J.R.R. Tolkien’s Lord of the Rings world. The game employs a set of rules to determine movement, combat, and magic use. Players take turns commanding their miniatures and maneuvering them around a battlefield constructed with terrain pieces. Six-sided dice are rolled to decide the outcome of actions, adding an element of chance to the battles.
The notions here are described in the blog TMAT dedicated to the game and its hobby. The original posts develop the simulators in Excel, which I try here to translate into R.
In MESBG, combat is works in two phases:
- The dueling phase to determine who has a chance of doing wounds
- The wounding phase to determine if and how many wounds have been given to the losing side of the duel
Dueling phase
Dice result generator
In MESBG, an ‘even duel’ refers to a combat scenario where both participating models possess identical statistics relevant to close-quarters combat. In such an instance, both combatants would share the same attack (duel) value and fight value. Consequently, the victor is solely determined by the outcome of a die roll, with the higher roll securing victory. Conversely, the lower roll results in defeat, and a tie necessitates a subsequent die roll to break the deadlock. Essentially, this encounter represents a symmetrical confrontation, where both participants possess statistically equivalent probabilities of success.
Here we will translate this into a dice outcome matrix
1
2
3
4
5
6
7
8
outcome_matrix <- matrix(c(
  "T", "E", "E", "E", "E", "E",
  "G", "T", "E", "E", "E", "E",
  "G", "G", "T", "E", "E", "E",
  "G", "G", "G", "T", "E", "E",
  "G", "G", "G", "G", "T", "E",
  "G", "G", "G", "G", "G", "T"
), nrow = 6, byrow = TRUE)
The horizontal line represents the rolls from team Evil and and the vertical line the rolls from team Good. We see that whenever both rolls match, it is a Tie.
| [,1] | [,2] | [,3] | [,4] | [,5] | [,6] | |
| [1,] | T | E | E | E | E | E |
| [2,] | G | T | E | E | E | E |
| [3,] | G | G | T | E | E | E |
| [4,] | G | G | G | T | E | E |
| [5,] | G | G | G | G | T | E |
| [6,] | G | G | G | G | G | T |
Calculating high dice value probabilties
In the game, odds are each side will be rolling more than one dice. We can calculate the probability of a a six-sided dice value being the highest value of a roll where multiple dices are thrown.
To quote TMAT:1
We know that there are 6 discrete probabilities when we roll 1 die, 36 discrete probabilities when we roll 2 dice, 216 discrete probabilities when we roll 3 dice, etc. How do we get these numbers? The answer is exponents: 6^1 (or 6) is 6, 6^2 (or 6x6) is 36, 6^3 (or 6x6x6) is 216 […]
How would we do this in R?
1
2
3
4
5
6
7
8
9
10
11
12
13
14
15
prob_matrix <- matrix(0, nrow = 6, ncol = 6) #Define a matrix with 6 rows and 6 columns, initialy filled with zeroes
for (highest in 1:6) { #Loop through all possible values from 1 to 6 that represent the *highest* value on the roll
  for (dice in 1:6) { #Inner loop that iterates for all possible values
    if (highest == 1) { #Calculates the probability of dice when the highest value is '1'
      prob_matrix[highest, dice] <- (1/6)^dice #Since there are 6 faces on the die, chance of success for each roll is 1/6
    } else { #Calculates probability when roll value is greater than 1 (all other iterations)
      prob_matrix[highest, dice] <- (highest/6)^dice - ((highest - 1)/6)^dice
      #The first term, (highest/6)^dice, represents the probability of successfully rolling all sides up to `dice`.
      #The second term, ((highest - 1)/6)^dice, represents the probability of successfully rolling all sides
      #strictly less than `dice` (i.e., failing to roll the highest value). Subtracting the second term
      #from the first term gives us the probability of NOT rolling anything higher than dice, which
      #is the complement of what we actually want (probability of rolling exactly `dice`).
    }
  }
}
| [,1] | [,2] | [,3] | [,4] | [,5] | [,6] | |
| [1,] | 0.16667 | 0.02778 | 0.00463 | 0.00077 | 0.00013 | 0.00002 |
| [2,] | 0.16667 | 0.08333 | 0.03241 | 0.01157 | 0.00399 | 0.00135 |
| [3,] | 0.16667 | 0.13889 | 0.08796 | 0.05015 | 0.02713 | 0.01425 |
| [4,] | 0.16667 | 0.19444 | 0.17130 | 0.13503 | 0.10044 | 0.07217 |
| [5,] | 0.16667 | 0.25000 | 0.28241 | 0.28472 | 0.27019 | 0.24711 |
| [6,] | 0.16667 | 0.30556 | 0.42130 | 0.51775 | 0.59812 | 0.66510 |
To interpret this table, we see that the chances that ‘1’ is the high roll when 6 dices are thrown is very slim (0.0002). If you roll one dice, all possible values have equal chance (0.16667).
Integrating model units stats
In MESBG, unit stats are represented by a collection of values that define a unit’s capabilities in combat, movement, and resilience. The following are those relevant for combat.
1
2
Team_Good <- list(DuelingDice = 4, FightValue = 7, WoundingAttacks = 4, WoundingDifficulty = 3)
Team_Evil <- list(DuelingDice = 6, FightValue = 4, WoundingAttacks = 6, WoundingDifficulty = 5)
As we can see both side do not have equal values. Team Evil will roll 6 dices to team Good’s 4 dices, but Team Good has a higher fight value, meaning that it wins ties when they both get same high value dice rolls.
Calculating probabilities of each side getting the high rolls
Using the DuelingDice value, we calculate the probabilities of each side getting the highest roll.
1
2
3
4
5
6
7
8
9
10
11
12
13
14
15
16
17
18
19
20
21
22
23
24
25
# Calculate probabilities for Team Good and Team Bad getting high values of 1 to 6
team_good_high_roll_probs <- prob_matrix[, Team_Good$DuelingDice]
team_evil_high_roll_probs <- prob_matrix[, Team_Evil$DuelingDice]

# Initialize probabilities for outcomes
prob_G <- 0
prob_E <- 0
prob_T <- 0

# Calculate the probabilities for each outcome
for (i in 1:6) {
  for (j in 1:6) {
    outcome <- outcome_matrix[i, j]
    prob_outcome <- team_good_high_roll_probs[i] * team_evil_high_roll_probs[j]

    if (outcome == "G") {
      prob_G <- prob_G + prob_outcome
    } else if (outcome == "E") {
      prob_E <- prob_E + prob_outcome
    } else if (outcome == "T") {
      prob_T <- prob_T + prob_outcome
    }
  }
}
Lets output the probabilities in an easy to read bar chart, using the ggplot2 package.
1
2
3
4
5
6
7
8
9
10
11
library(ggplot2)
# Example data frame for visualization
data <- data.frame(
  Outcome = c("G", "E", "T"),
  Probability = c(prob_G, prob_E, prob_T) * 100
# The graph
ggplot(data, aes(x = Outcome, y = Probability, fill = Outcome)) +
  geom_bar(stat = "identity") +
  theme_minimal() +
  labs(title = "Outcome Probabilities", x = "Outcome", y = "Probability (%)")+
 geom_text(aes(label = round(Probability,2)), vjust = -0.5, size = 4)
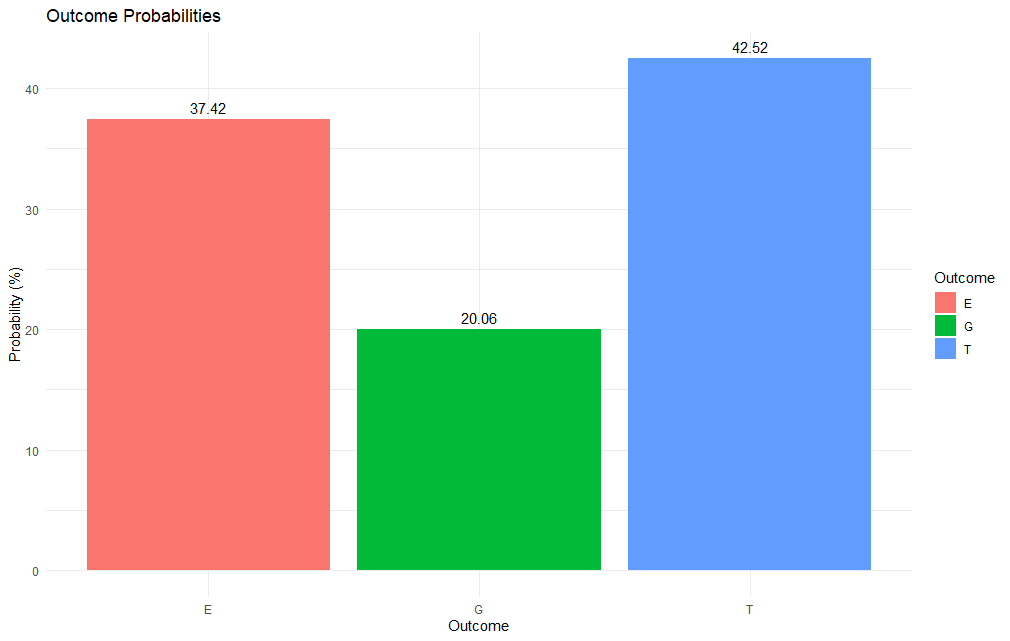
As we can see ties are the most probable outcomes (both side rolling the highest value dice). The side with the highest FightValue wins ties. Let’s add this to our calculations with a simple IF statement.
1
2
3
4
5
6
7
8
9
10
11
# Allocate tie probabilities to Team Good due to higher Fight Value
if (Team_Good$FightValue > Team_Evil$FightValue) {
  prob_G <- prob_G + prob_T
} else {
  prob_B <- prob_E + prob_T
}

# Calculate total win probabilities
total_win_prob_Good <- prob_G
total_win_prob_Evil <- prob_E
Let us put it in a graph again for easier comparison.
1
2
3
4
5
6
7
8
9
10
data <- data.frame(
  Outcome = c("G", "E"),
  Probability = c(total_win_prob_Good, total_win_prob_Evil) * 100
)

ggplot(data, aes(x = Probability, y = Outcome, fill = Outcome)) +
  geom_bar(stat = "identity", width = 0.4)+
  theme_minimal() +
  labs(title = "Outcome Probabilities", x = "Probability (%)", y = "Outcome") +
  geom_text(aes(label = round(Probability, 2)), hjust = -0.1, size = 4)
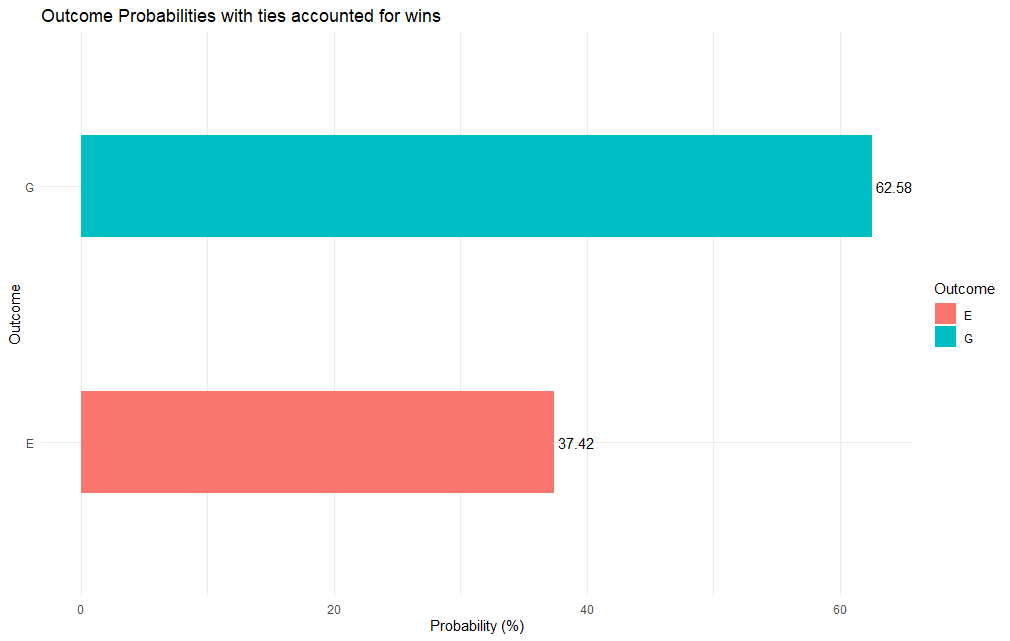
Winning ties lead to a big advantage, even if team Good get less dice rolls.
Wounding phase
Calculting average expected wounds
Again to quote from TMAT:2
In MESBG, your probability of wounding something is usually determined by both the Strength of your model(s) AND the Defense of the opposing model(s). Based on the interplay of Strength and Defense, we have a few different wounding probabilities:
1
2
3
4
5
6
# Create list of values for the wound difficulty table
roll_value <- c(1, 2, 3, 4, 5, 6)
wound_prob <- c(1.000, 0.833, 0.667, 0.500, 0.333, 0.167)

# Combine into a data frame
wounding_table <- data.frame(roll_value = roll_value, wound_prob = wound_prob)
| roll_value | wound_prob |
| 1 | 1.000 |
| 2 | 0.833 |
| 3 | 0.667 |
| 4 | 0.500 |
| 5 | 0.333 |
| 6 | 0.167 |
Note that I am skipping over the uncommon difficulty values to keep the exercise more succint. Using this probability table we now identify the wound_prob for the roll_value that matches both teams’ WoundingDifficulty.
1
2
3
# Find the Wound_prob value for the Roll_value that matches both teams WoundingDifficulty
matching_aew_prob_Good <- wounding_table$wound_prob[wounding_table$roll_value == Team_Evil$WoundingDifficulty]
matching_aew_prob_Evil <- wounding_table$wound_prob[wounding_table$roll_value == Team_Good$WoundingDifficulty]
| Team | Value |
|---|---|
| Evil | 0.667 |
| Good | 0.333 |
We can now calculate the average expected number of wounds
1
2
3
4
expected_aew_Good <- Team_Good$WoundingAttacks * matching_aew_prob_Good
expected_aew_Evil <- Team_Evil$WoundingAttacks * matching_aew_prob_Evil
expected_aew_win_Good <- expected_aew_Good * total_win_prob_Good
expected_aew_win_Evil <- expected_aew_Evil * total_win_prob_Good
This returns the following values:
- Expected number of wounds for Team Good: 1.33
- Expected number of wounds for Team Evil: 4.00
- Expected number of wounds for Team Good with Win: 0.83
- Expected number of wounds for Team Evil with Win: 2.50
We see that even though team Evil is expected to win less duels, his chances of inflicting wounds when he does is mucher higher, resulting in a higher average of wounds then team Good.
For simplicity’s sake I have not accounted for a number of rules such as special weapons and might points. These would have to be included to do proper estimates of the game’s probable outcomes.
Next post I will be looking into performing Monte Carlo simulations based off MESBG.
(2021a, March 18). MATH: Am I gonna win this duel? https://tellmeatalegreatorsmall.blogspot.com/2021/03/math-am-i-gonna-win-this-duel.html ↩
(2021, October 21). Dueling Calculator: Average expected wounds. https://tellmeatalegreatorsmall.blogspot.com/2021/10/dueling-calculator-average-expected.html ↩